So what is a knowledge graph, anyway?
If you are reading this article, chances are you're eager to uncover the answer to this question. Perhaps you've come across intimidating terms like "ontology," "RDF", "inference", "formal semantics", or "SPARQL" that shroud the topic of knowledge graphs in a cloak of technical mystery. Or maybe you're simply intrigued by this fascinating approach to organizing your organizational knowledge but not sure what it really entails. No matter the reason, we are here to introduce you to the concept of knowledge graphs - and offer you a glimpse of the power they hold.
The problem Knowledge Graphs solve
It is perhaps most effective to introduce knowledge graphs through a problem they are trying to solve. While they are a very versatile knowledge organization paradigm, a common theme in their usage is joining together diverse datasets in a meaningful way.
Living in our era of information overload, we can see why data unification is such a pertinent problem. Finding meaningful connections amidst a sea of disparate data has become an increasingly daunting task for companies and organizations of all sizes and scopes. Traditional databases structured as a series of interconnected tables struggle to capture the intricate relationships and meaning nuances that underpin our knowledge. In other words, a lot of things are not easily stored and expressed in an Excel spreadsheet.
More than that, data silos, where different bits of enterprise data are spread among different databases and teams, became a huge and expensive challenge to overcome. Siloed data results in significant obstacles for businesses, including impaired decision-making due to lack of comprehensive data, increased costs to manage and analyze scattered datasets, and ultimately, a significant waste of time and resources.
That is where knowledge graphs appear on the stage. Knowledge Graphs (KGs) are a dynamic and versatile tool that effectively gather all data and domain logic into a single network in a consistent manner. This allows the data to be interoperable. That is, while in the data silo world each dataset speaks its own “language”, so to speak, and in the interoperable world, all datasets speak one “language” and can be used together. Knowledge graphs achieve that by enriching the datasets with contextual information (domain logic) that provides uniform definitions across the datasets.
But let's break it down further, starting with what we really mean by the words “knowledge” and “graph”.
Knowledge = data + context
Knowledge is not simply data
In our digital age we often hear terms centered around the acquisition and harnessing of the power of data, such as “Big Data”, “data science”, and so on. However, in the day-to-day of many operations we often, if not always, operate with more than just data. In order to make data useful, we need to understand, interpret, analyze and present it. That process elevates the data that we have into being operable and meaningful bits of information that we can also call knowledge.
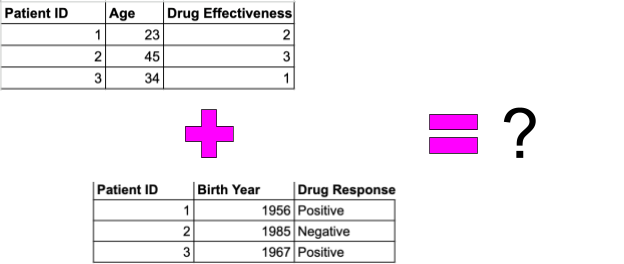
Let's consider an example in the medical field. Imagine two datasets: one from a medical research institution that records patient ages and incidences of a specific disease, and another from a pharmaceutical company that documents drug administration, using different terms and definitions. In the first dataset, "Age" is recorded in years, and "Disease Incidence" is denoted as "Positive" or "Negative", and “Drug Effectiveness” is denoted on a scale from 0 to 5. Meanwhile, in the second dataset, the “Age” attribute is expressed through “Birth Year”, while "Drug Response" is defined as "Effective" or "Ineffective." Without a shared terminology and data model (the context), it will be difficult to compare patient age and drug response as they use different property names and values. Thus, the datasets cannot be directly compared or integrated, limiting their collective utility.
It follows that simply having the data at hand, even if it is available, is not enough. We need to understand what the data means and how to approach it with our inquiry.
For example, consider a dataset that records yearly temperatures and rainfall for a certain geographic area. On its own, this data is simply a table of numbers. However, given the context of environmental science and knowledge about local ecosystems, we can interpret this data to draw conclusions about climate change and its potential impacts on the local flora and fauna. This transformed data can then serve to inform policy and conservation efforts.
This kind of integration of the data with context is what Knowledge Graphs can achieve, giving a much richer and actionable information landscape for various data management use cases.
Knowledge evolves with changing context
Another important property of knowledge that is crucial for decision making is that it evolves over time. Ways of thinking, laws and regulations, current state of science, organizational data management all change over time. Many traditional knowledge organization systems would struggle to extend the database making it difficult for systems to evolve.
Traditional databases, while powerful, come with their own set of drawbacks. They're built around rigid schemas, meaning that the structure of the database has to be established in advance and cannot be easily modified. This rigidity can be problematic when dealing with complex, evolving datasets. If new types of data emerge or if the relationships between data elements change, it can be difficult to accommodate these changes within the framework of a traditional database.
Remember the above example in the medical field? What happens when the pharmaceutical company suddenly decides to add additional labels for “Drug Response”, such as adding an additional scale of drug effectiveness? Or when the research institution decides that “Drug Effectiveness” cannot be measured in one column, and adds several more with various parameters relating to it?
But here's where knowledge graphs truly shine, setting them apart from traditional (relational) databases filled with raw data. In contrast, knowledge graphs offer the flexibility to accommodate changes and additions to the data structure over time. It's like assembling a puzzle where you decide what it is and how large it is going to be.
Graph = network = things (nodes) + relationships (edges)
Visualize a network, a web of nodes (representing entities) interconnected by edges (representing relationships). This network is an example of a graph, which is just a fancy industry word for saying a network. If you have seen a metro map in a large city, have created a mind-map, or have seen a fuzzy visualization of the World Wide Web, you know what a graph is.
The nodes and edges can represent many things depending on the kind of graph you are looking at. For example, in a metro system map, nodes represent the metro stations, while edges represent the tracks/connections between the stations; thus we understand that we can travel from one node to the next only if there is an edge between them. On the other hand, in a mind-map nodes are certain entities or ideas, and edges may be the relationships between the entities and ideas.
In knowledge graphs, we have nodes as entities, which can be anything (people, buildings, dates, values, etc.), and edges as relationships between the entities. For example, we can represent a small part of LinkedIn’s network of connections as a graph in the image below. In this case, the nodes represent individuals or organizations, and edges denote connections.
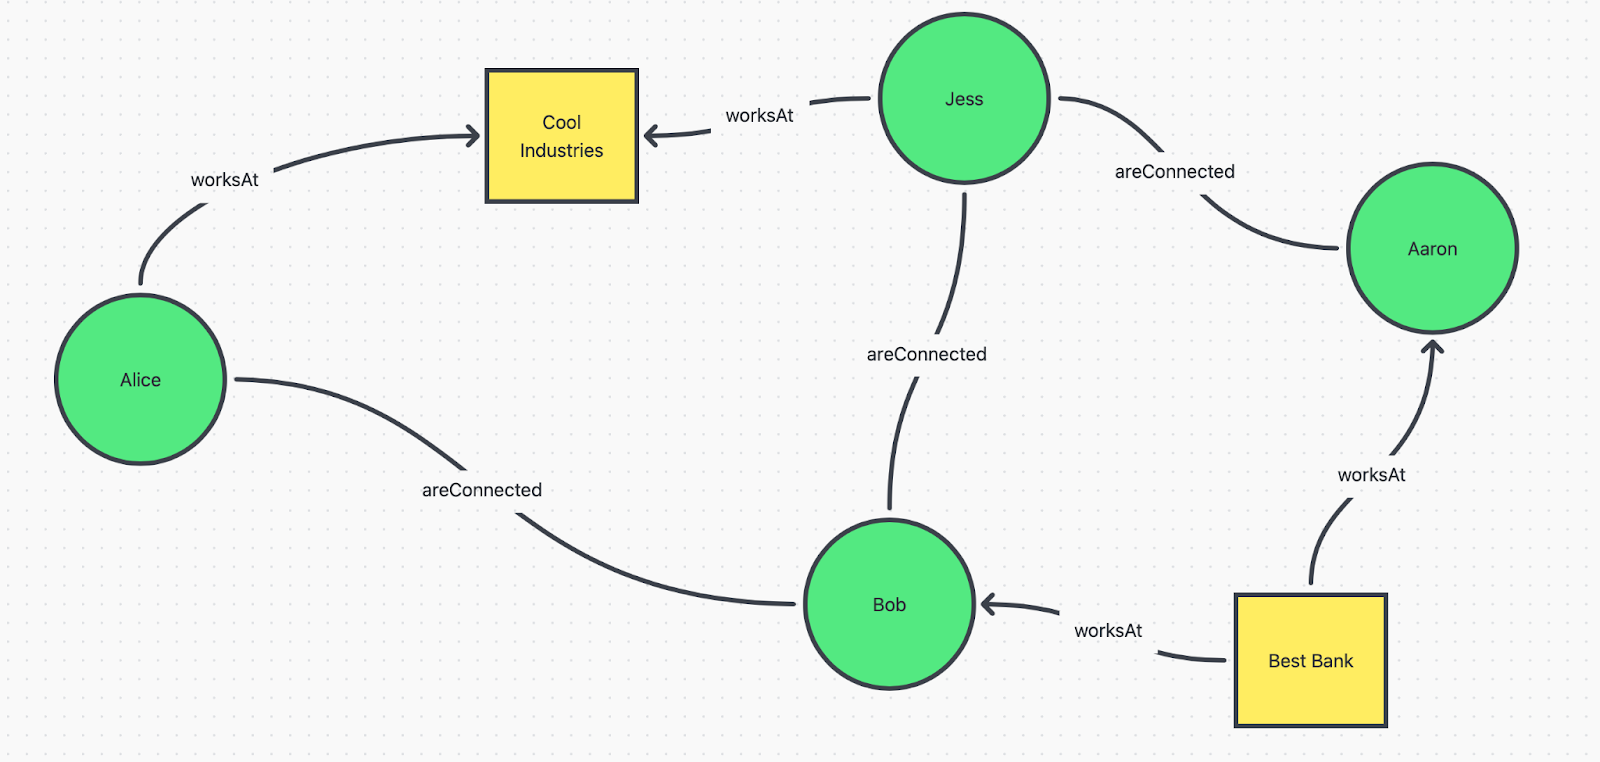
This graph showcases how people and organizations are connected, showing the relationships of employment (worksAt) and having a connection (areConnected) in a very intuitive way. For example, we know that Jess works at Cool Industries, and has Bob and Aaron as her Connections, but we also see that Aaron and Bob work for the same Best Bank,
A graph structure is thus a very powerful tool that we can use to represent the richness and complexity of our world, where everything is connected in intricate patterns.
Finally, what is a Knowledge Graph?
Now after diving into what knowledge, data and a graph are, we can finally understand what a knowledge graph is.
Knowledge graph = contextualized interconnected network of data
A knowledge graph structures knowledge (data + context) in the flexible framework of a network, allowing for the representation of interconnected entities and their relationships. It organizes and represents knowledge in a way that captures both the data and its contextual associations. It's like having a compass that guides you through the intricacies of knowledge, enabling you to explore, discover patterns, and uncover valuable insights that drive innovation, optimization, and informed decision-making.
The networked structure and shared terminology that is used to build such a network allows for the data to be understandable not only by humans but also by computers, opening up ways for automation and AI integration opportunities. For example, consider a small part of Wikidata, one of the largest public general-purpose knowledge graphs. We can immediately see that the fresco “School of Athens’ is created by Raphael, and that it depicts socrates who is also the main subject of the painting “The Death of Socrates” by Jacques-Louis David. We see how easy we can express very different entities, like paintings and people, in a single graph.
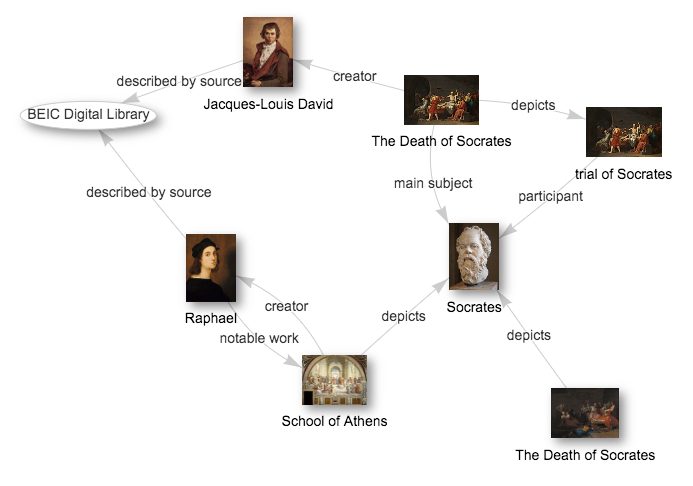
Knowledge graphs provide infrastructure for breaking data silos
Knowledge graphs provide the infrastructure for breaking data silos by fostering integration and interoperability among diverse datasets. They allow different data elements to be linked together regardless of their source, structure, or format. This connectivity helps in eliminating data silos as the graph can easily incorporate and reconcile data from disparate sources.
In our pharmaceutical example above, we had a problem where the research institution data would store patient age and drug effectiveness using different fields and data values from those used by the pharmaceutical company. Using a knowledge graph, the pharmaceutical company can implement a unified terminology that would render that problem obsolete.
Through this unification, knowledge graphs promote a more holistic understanding of data, enabling data-driven decisions that consider all available information. They also allow for a much smoother flow of information within an organization, improving internal communication, efficiency, and overall productivity.
Knowledge graphs are flexible and evolvable
Knowledge graphs are flexible and evolvable, capable of adapting to accommodate new data types, relationships, and sources. Unlike traditional relational databases which require a fixed schema, knowledge graphs can easily adjust their structure to incorporate new nodes and relationships. This makes knowledge graphs highly scalable and future-proof. They can grow and change with an organization's needs, ensuring that they remain a relevant and powerful tool for knowledge management - even as the data landscape continues to evolve.
How Are Knowledge Graphs Used?
Finance
In the context of financial fraud detection, knowledge graphs enable the integration and analysis of vast amounts of heterogeneous data from multiple sources, including transaction records, customer profiles, and historical fraud patterns. By representing relationships between entities and events, knowledge graphs can uncover hidden connections and identify suspicious activities that might otherwise remain undetected.
Supply Chains
In supply chain management, knowledge graphs streamline the complex web of interconnected entities, such as suppliers, manufacturers, and logistics partners, to enhance visibility and optimize operations. They facilitate tracking, demand forecasting, and risk assessment, enabling businesses to respond swiftly to disruptions and minimize inefficiencies.
Enterprise Semantic Layer
The enterprise semantic layer serves as a central component in organizations' data management and analytics strategies, offering a unified and standardized view of data across the entire enterprise. By consolidating and abstracting complex data sources, such as databases, data warehouses, and APIs, into a cohesive semantic model, the enterprise semantic layer simplifies data access and interpretation for business users and analysts. This abstraction shields end-users from the underlying technical complexities and ensures consistent and accurate data representation across various reporting and analytical tools. Consequently, enterprises can foster a data-driven culture, as business users gain self-service access to trusted and up-to-date information, enabling faster and more informed decision-making.
Healthcare and Biology
In the healthcare sector, knowledge graphs enhance patient care and research by consolidating medical data, clinical studies, and drug interactions into a comprehensive network. This aids in precision medicine, disease diagnosis, and drug discovery, leading to more personalized and effective healthcare solutions.
Knowledge graphs have found extensive applications in various domains within the biological sciences, revolutionizing research and discovery. In this context, knowledge graphs enable the integration of biological data from diverse sources, such as genomic sequences, protein interactions, and scientific literature, facilitating the identification of gene-disease associations, drug-target interactions, and potential biomarkers. They play an important role in enabling researchers to analyze complex biological networks and identify crucial relationships between genes, proteins, and diseases.
Digital Twins
In the realm of digital twins, knowledge graphs are instrumental in creating virtual replicas of physical systems, products, or processes. By modeling and connecting various components, sensors, and real-time data streams, knowledge graphs empower industries like manufacturing, and urban planning to monitor and optimize performance, predict failures, and simulate scenarios. These insights lead to enhanced operational efficiency, reduced downtime, and improved decision-making.
Government Transparency
For government funding tracking and visualization, knowledge graphs help the public and policymakers monitor and analyze funding allocations across various sectors and projects. By capturing the relationships between funding sources, beneficiaries, and funding areas, knowledge graphs offer transparency and accountability in public spending. They provide interactive visualizations that enable stakeholders to grasp funding trends, identify gaps, and allocate resources more strategically, promoting effective and evidence-based policymaking.
In all these domains, knowledge graphs offer valuable insights, empowering decision-makers with a deeper understanding of their data and fostering innovation and efficiency.